# package imports
from artools.loading_utils import load_ais, load_cell_areas, load_catalog
from artools.attribute_utils import find_region_masks, find_landfalling_region, extract_trajectory, add_start_date, add_end_date
import xarray as xr
from matplotlib.cm import Set3
from matplotlib import pyplot as plt
import cartopy.crs as ccrs
import pandas as pd
import matplotlib.path as mpath
import cartopy.feature as cfeature
from cartopy.util import add_cyclic_point
import seaborn as sns
from scipy import stats
import numpy as np
/home/jovyan/antarctic_AR_dataset/notebooks
# load up input products
ais_mask = load_ais()
cell_areas = load_cell_areas()
# load up catalog
full_catalog = load_catalog('epsspace0.5_epstime12_minpts5_nreppts10_seed12345.h5')
landfalling_catalog = full_catalog[full_catalog.is_landfalling]We add several features to the catalog, including landfalling region, trajectories of ARs, start dates, and end dates
# add features to catalog
region_defs_coarser = {'West': [-150, -30],
               'East 1': [-30, 75],
               'East 2': [75, -150]}
region_masks_coarser = find_region_masks(region_defs_coarser, ais_mask)

landfalling_catalog['coarser_region'] = landfalling_catalog['data_array'].apply(lambda x:
                                                                                find_landfalling_region(x, cell_areas, region_masks_coarser))
landfalling_catalog['trajectory'] = landfalling_catalog['data_array'].apply(extract_trajectory)
landfalling_catalog['start_date'] = landfalling_catalog['data_array'].apply(lambda x:
                                                                           add_start_date(x, ais_mask))
landfalling_catalog['end_date'] = landfalling_catalog['data_array'].apply(lambda x:
                                                                           add_start_date(x, ais_mask))
region_areas = {}
for region, mask in region_masks_coarser.items():
region_areas[region] = mask.dot(cell_areas).values/(10**6)color_mapping_coarser = {'East 1': Set3(4), 'East 2': Set3(5), 'West': Set3(9)}
fig = plt.figure(figsize=(11,4))
ax1 = plt.subplot(131, projection=ccrs.Stereographic(central_longitude=0., central_latitude=-90.))
for index, row in landfalling_catalog.iterrows():
trajectory = row.trajectory
ax1.plot(trajectory.avg_lon, trajectory.avg_lat, transform=ccrs.Geodetic(), color=color_mapping_coarser[row.coarser_region], alpha=0.1)
for label in region_defs_coarser.keys():
if label == 'East 2':
ax1.text((region_defs_coarser[label][0] + region_defs_coarser[label][1])/2 + 180, -53, label, fontsize=14, horizontalalignment='center', bbox=dict(facecolor='black', edgecolor=color_mapping_coarser[label], boxstyle='round'), transform=ccrs.PlateCarree(), color=color_mapping_coarser[label], zorder=40)
else:
ax1.text((region_defs_coarser[label][0] + region_defs_coarser[label][1])/2, -53, label, fontsize=14, horizontalalignment='center', bbox=dict(facecolor='black', edgecolor=color_mapping_coarser[label], boxstyle='round'), transform=ccrs.PlateCarree(), color=color_mapping_coarser[label], zorder=40)
ice_shelf_poly = cfeature.NaturalEarthFeature('physical', 'antarctic_ice_shelves_polys', '50m',edgecolor='none',facecolor='lightcyan') # 10m, 50m, 110m
ax1.add_feature(ice_shelf_poly,linewidth=3)
ice_shelf_line = cfeature.NaturalEarthFeature('physical', 'antarctic_ice_shelves_lines', '50m',edgecolor='black',facecolor='none') # 10m, 50m, 110m
ax1.add_feature(ice_shelf_line,linewidth=1,zorder=13)
ax1.coastlines(resolution='110m',linewidth=1,zorder=32)
ax1.set_extent([-180,180,-90,-42], ccrs.PlateCarree())
ax1.set_title('(a) Landfalls by Region')
# Map extent
#ax.gridlines(alpha=0.5, zorder=33)
#fig.savefig(str(home_dir) + '/plots/paper_plots/regional_trajectory_map.png', dpi=100)
ax2 = plt.subplot(132)
sns.countplot(landfalling_catalog, x='coarser_region', ax=ax2, order=['West', 'East 1', 'East 2'], hue='coarser_region', palette=color_mapping_coarser)
ax2.set_title('(b) Landfall Counts')
ax2.set_ylabel('ARs')
ax2.set_xlabel('')
ax3 = plt.subplot(133)
region_df = landfalling_catalog.groupby('coarser_region').size()
region_df = pd.concat([region_df.rename('count'), pd.Series(region_areas).rename('area')], axis=1, names=['coarser_region', 'area'])
region_df['storms_per_area'] = region_df['count']/region_df['area']
sns.barplot(data=region_df, x=region_df.index, y='storms_per_area', ax=ax3, order=['West', 'East 1', 'East 2'], hue=region_df.index, palette=color_mapping_coarser)
ax3.set_title('(c) Landfall Counts/Region Area')
ax3.ticklabel_format(style='sci', axis='y', scilimits=(0, 0))
ax3.set_ylabel(r'ARs/km$^2$')
ax3.set_xlabel('')
fig.tight_layout(pad=1)
fig.savefig('../output/plots/regional_counts.png', dpi=100)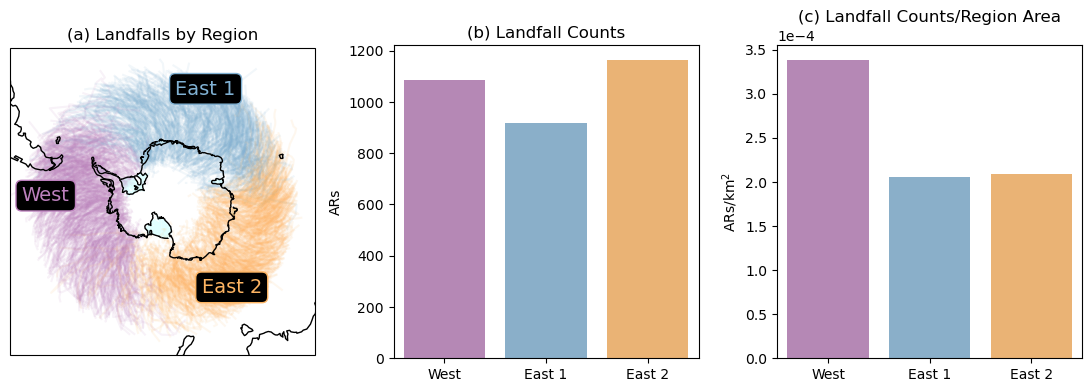
years = landfalling_catalog.start_date.dt.year
landfalling_catalog['landfalling_year'] = years
year_df = landfalling_catalog.groupby('landfalling_year', as_index=False).size()year_df['size'].describe()count 43.000000
mean 73.604651
std 10.761792
min 47.000000
25% 68.000000
50% 73.000000
75% 80.500000
max 99.000000
Name: size, dtype: float64fig, axs = plt.subplots(nrows=4, ncols=1, figsize=(6,8))
cur_ax = axs[0]
sns.regplot(data=year_df, x='landfalling_year', y='size', ci=None, line_kws={"color": "red"}, ax=cur_ax)
ar_rate = round(stats.linregress(year_df.landfalling_year, year_df['size'])[0], 2)
text = f'+{ar_rate} ARs/yr'
cur_ax.set_title('Antarctic-wide')
cur_ax.set_ylim([0, 120])
cur_ax.set_xticks(np.arange(1980, 2021, 5))
cur_ax.text(1981, 100, s=text, fontsize=12)
cur_ax.set_xlabel('')
cur_ax.set_ylabel('ARs')
cur_ax.grid(True)
year_df = landfalling_catalog.groupby(['landfalling_year', 'coarser_region'], as_index=False).size()
coord = 1
for label in region_masks_coarser.keys():
cur_ax =axs[coord%4]
year_region_df = year_df[year_df.coarser_region == label]
sns.regplot(data=year_region_df, x='landfalling_year', y='size', ci=None, line_kws={"color": "red"}, ax=cur_ax)
ar_rate = round(stats.linregress(year_region_df.landfalling_year, year_region_df['size'])[0], 2)
text = f'+{ar_rate} ARs/yr'
cur_ax.set_title(label)
cur_ax.set_ylim([0, 50])
cur_ax.set_xticks(np.arange(1980, 2021, 5))
cur_ax.text(1981, 40, s=text, fontsize=12)
cur_ax.set_xlabel('')
cur_ax.set_ylabel('ARs')
cur_ax.grid(True)
coord += 1
fig.tight_layout()
fig.savefig('../output/plots/regional_count_trends.png', dpi=100)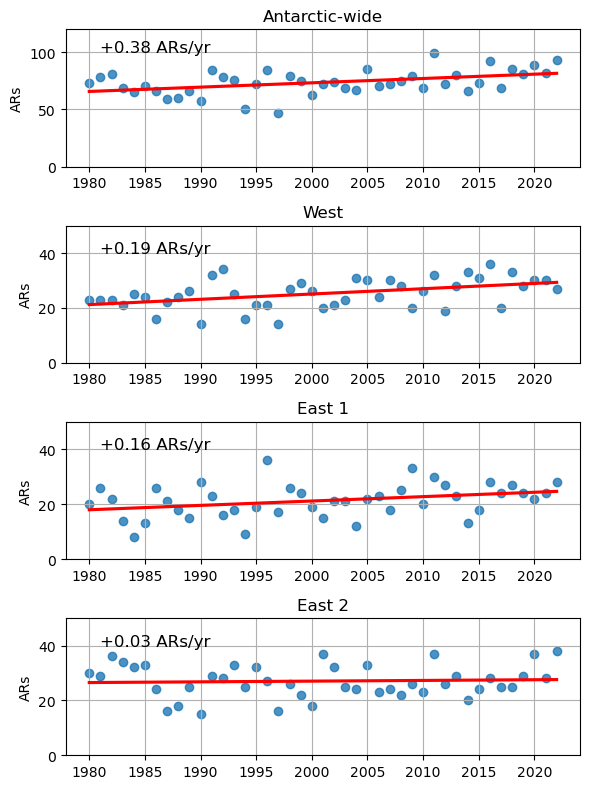
year_df.groupby('coarser_region')['size'].describe()Loading...