How ARs are detected
In Wille (2021), Antarctic ARs are detected on a pixelwise basis, where a pixel is considered part of an AR if the poleward integrated vapor transport (as derived from MERRA-2) is higher than the 98th percentile of that pixel location’s vIVT data across all years for that particular month. The equation for poleward integrated vaport transport is shown below:
This catalog seeks to cluster the individual AR pixels spatiotemporally into individual storm events to facilitate analysis of characteristics and impacts of ARs on the Antarctic Ice Sheet on a storm-by-storm basis. To accomplish this, we use a modified DBSCAN algorithm with two steps:
- Spatial Clustering: Partition AR pixels spatially at each time step using DBSCAN
- Spatiotemporal Clustering: Stitch together the identified clusters across time using a spatiotemporal DBSCAN (Birant (2007)).
Below, we describe the stages of our clustering algorithm in a bit more detail.
Spatial Clustering
First, for each time step where there are AR pixels present, we cluster them into individual groups and storms using the standard DBSCAN algorithm.
Figure 1 shows an example of this step, for a particular time step.
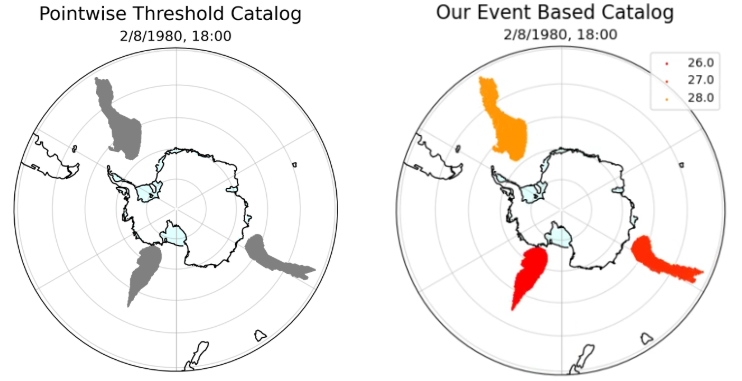
Figure 1:Results of spatial clustering step: previously unlabelled AR pixels are grouped together by proximity and given storm labels.
Spatiotemporal Clustering
Next, we randomly sample some collection of pooints within each cluster generated with the previous step, and cluster these representative points across space and time to generate spatiotemporal clusters using the ST-DBSCAN algorithm in Birant (2007).
Figure 2 shows an example of how the clusters identified in the time frames around that of Figure 1 are stitched together across time.
Figure 2:Results of spatiotemporal clustering step: storms identified spatially within each time step are stitched together across time, with storm labels carried accordingly.
- Wille, J. D., Favier, V., Gorodetskaya, I. V., Agosta, C., Kittel, C., Beeman, J. C., Jourdain, N. C., Lenaerts, J. T. M., & Codron, F. (2021). Antarctic Atmospheric River Climatology and Precipitation Impacts. Journal of Geophysical Research: Atmospheres, 126(8). 10.1029/2020jd033788
- Birant, D., & Kut, A. (2007). ST-DBSCAN: An algorithm for clustering spatial–temporal data. Data & Knowledge Engineering, 60(1), 208–221. 10.1016/j.datak.2006.01.013